Analytics tool for product trends
Designed a module for building product reports that answer market questions no cookie-cutter dashboard could.
- ANALYTICS PLATFORM
- ADVANCED FILTERING
- REPORTS
- Company
- Grips Intelligence
- My role
- Lead Designer
- Team
- 1 PM, 1 developer, 1 designer
- Timeline
- 2024 · 2 months
- Platform
- Web app (desktop-first)
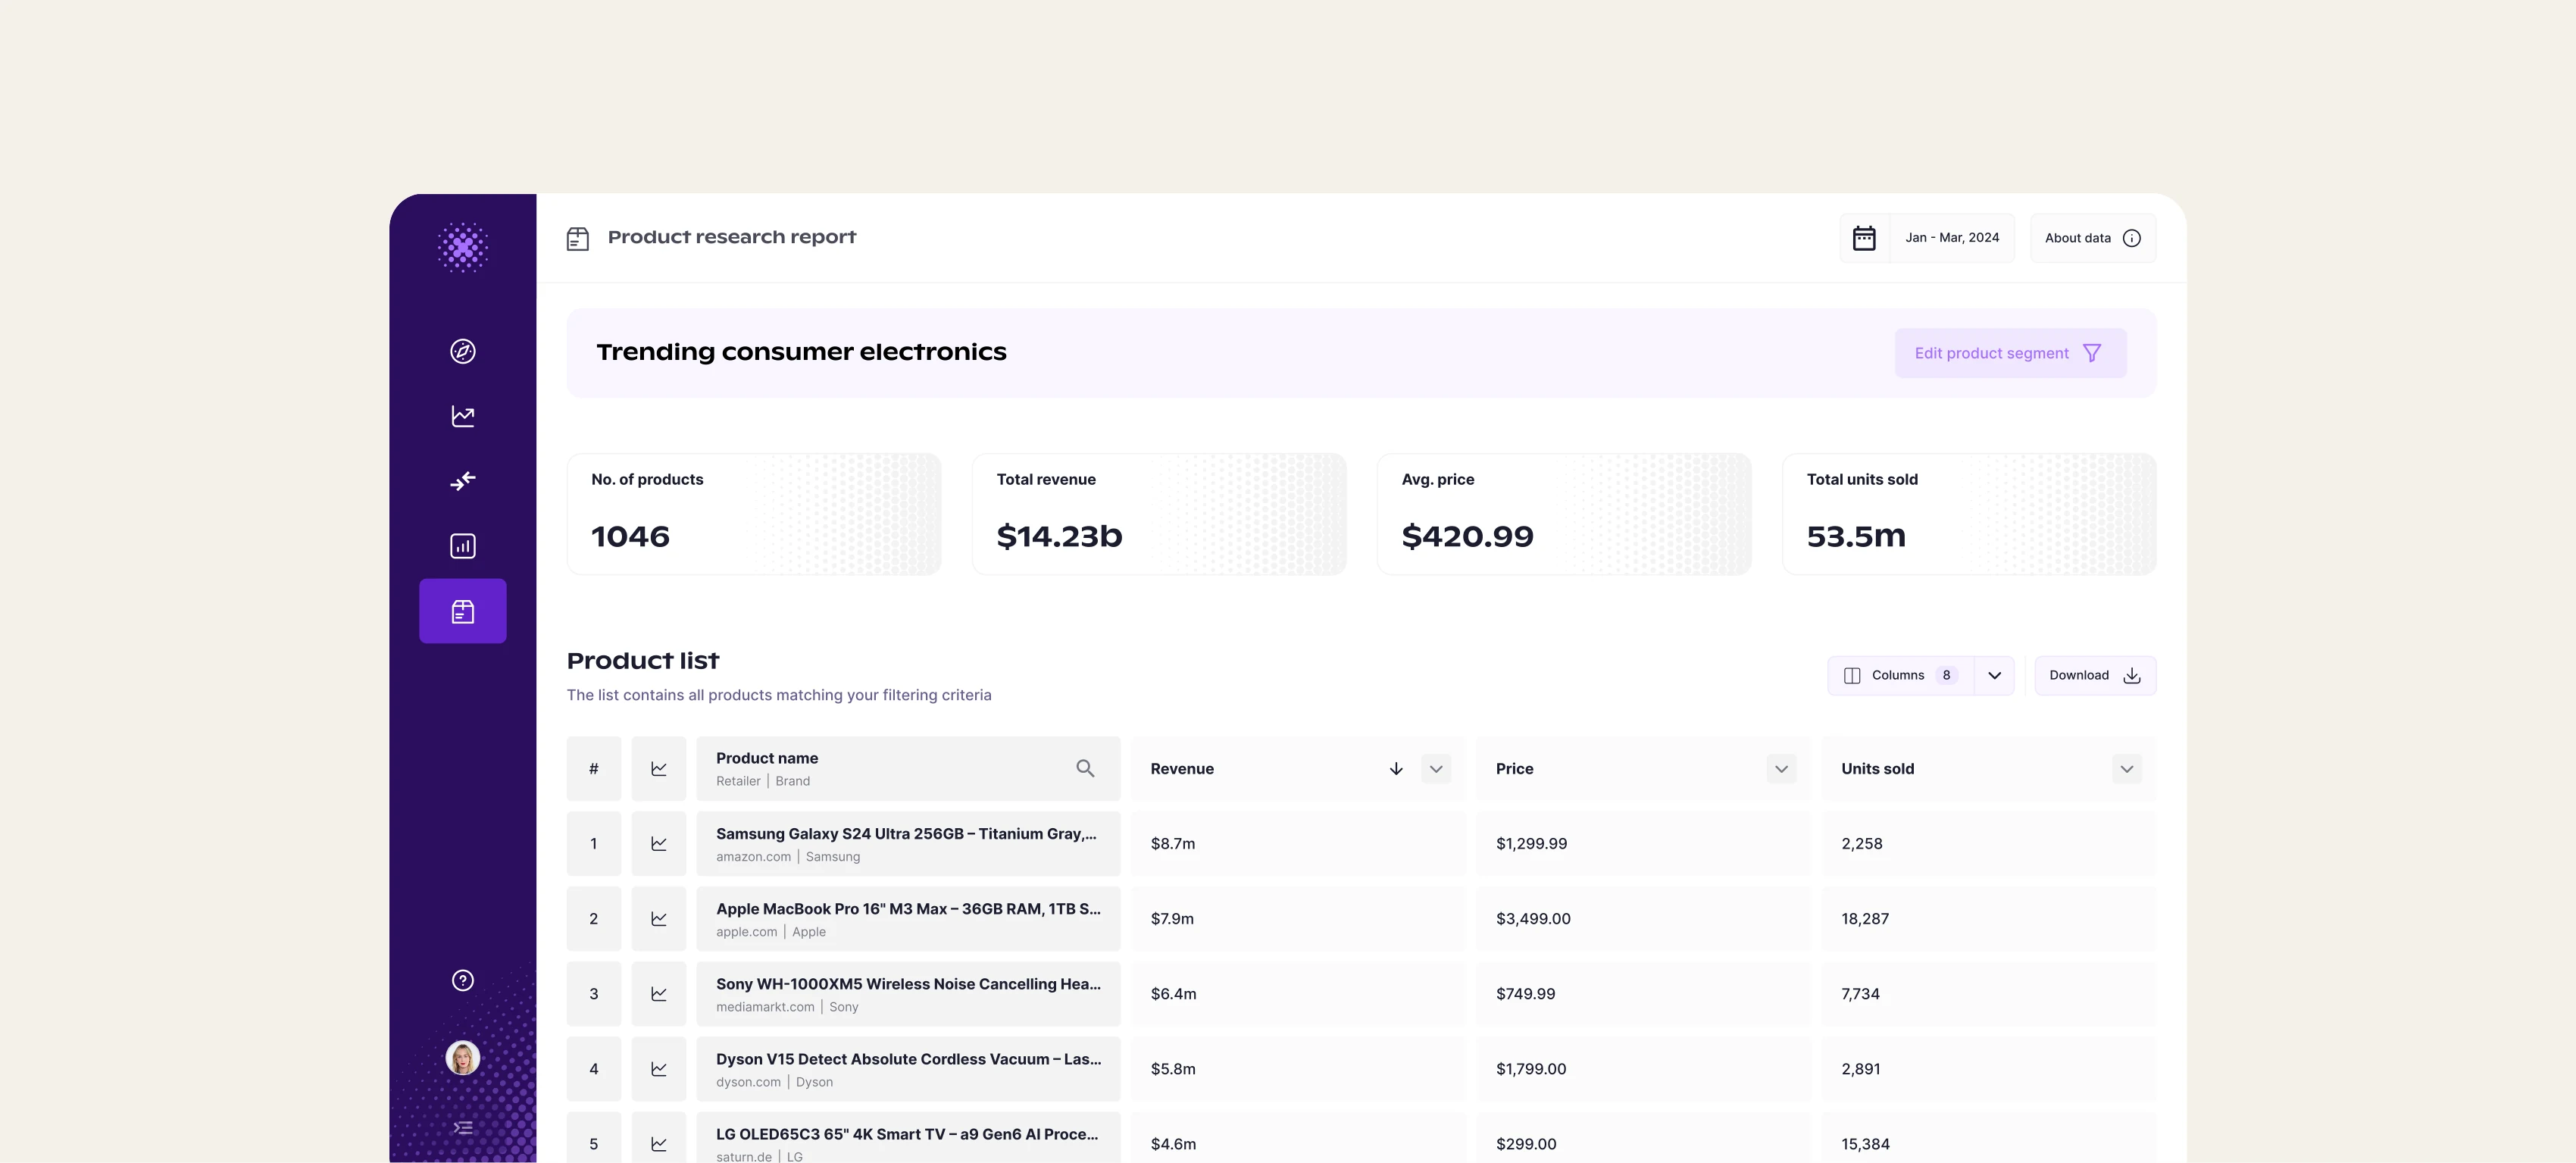
Context
New dataset in - more granular, more actionable
Grips analytics platform gave e-commerce businesses insight into competitors' revenue, growth over time, market share. But knowing where competitors stood wasn't enough. Customers wanted to spot shifts early enough to act on them. That’s where Grips' new data product, SKU performance data, would shine.
Problem
Users needed to know what sells, before it’s too late
Access to data doesn't equal insight. Even with Grips offering the most granular SKU-level sales data on the market, users needed a way to cut through it - to know quickly what was selling, and at what price, so they could change product pricing, adjust positioning, or even update their offering before a trend fully played out.
Data variability stood in the way
The data itself came from many different sources, each structured a little differently; so the same kind of information didn't always live in the same place. A question like 'what pattern is trending across my competitors' could be answered by the data, but the answer might sit in a 'Pattern' column for one product, be folded into 'Color' for another, or only show up buried in a product title for a third. The data team was working on unifying these sources long-term, but that wasn't something users could wait on. The immediate challenge was making sense of that inconsistency as it existed and helping users find the signal without needing to know where, in this particular case, it happened to be hiding.
Solution
A flexible filtering system to cut through the noise
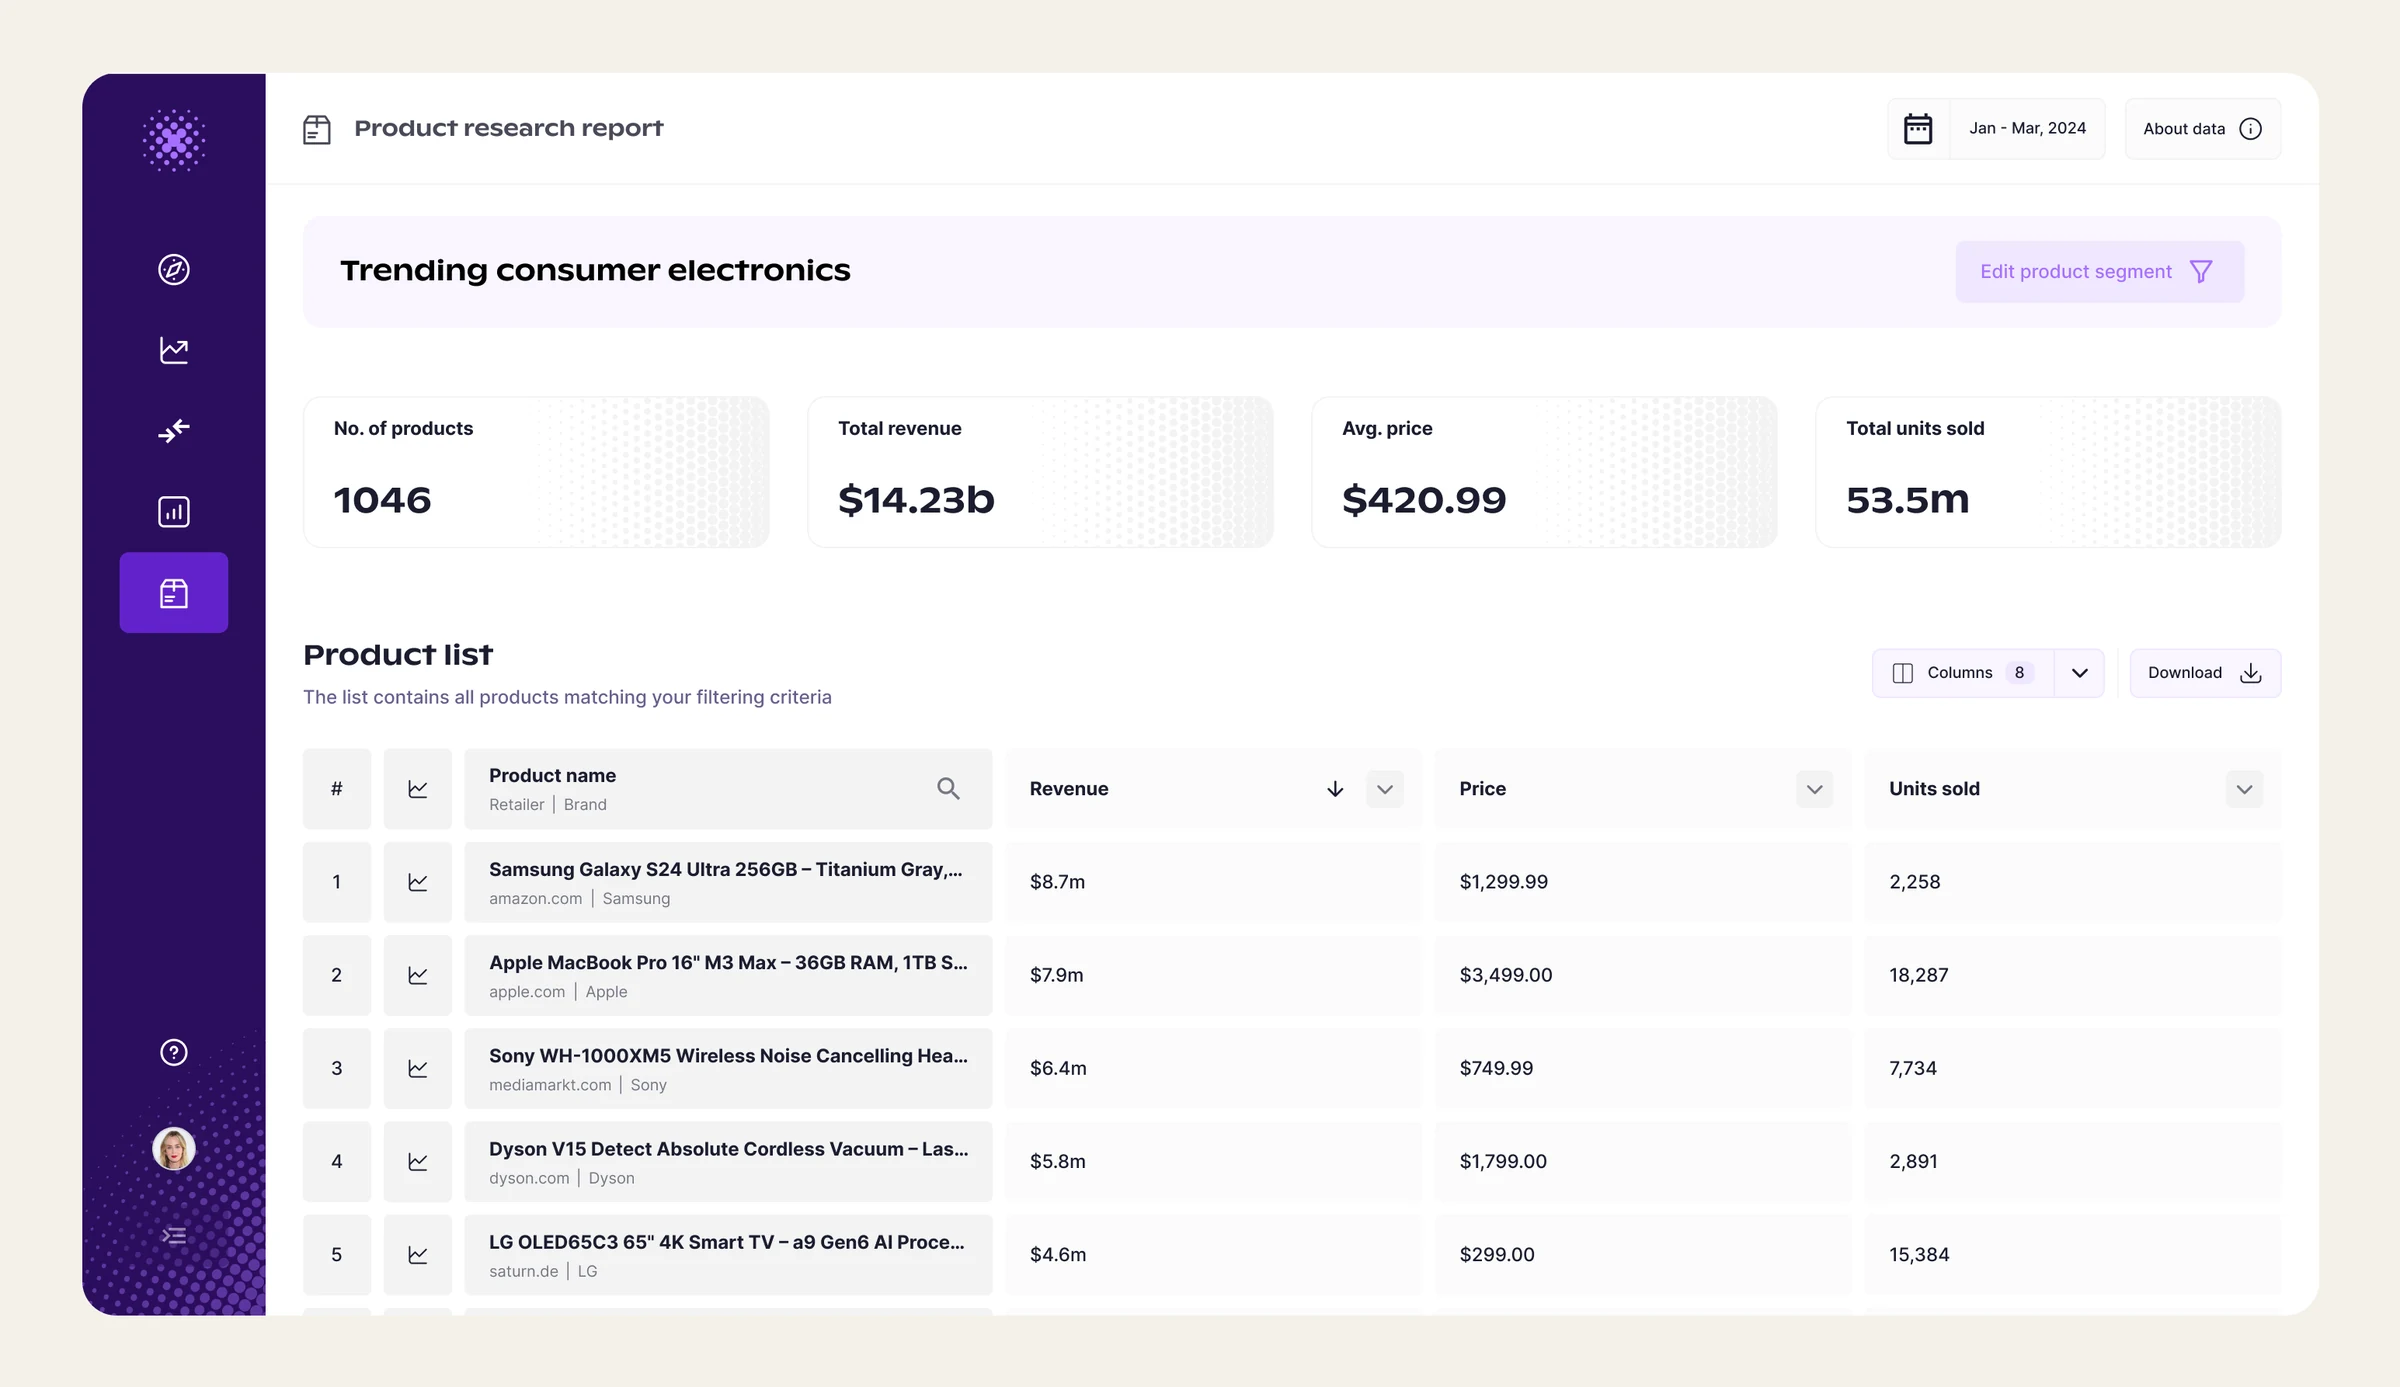
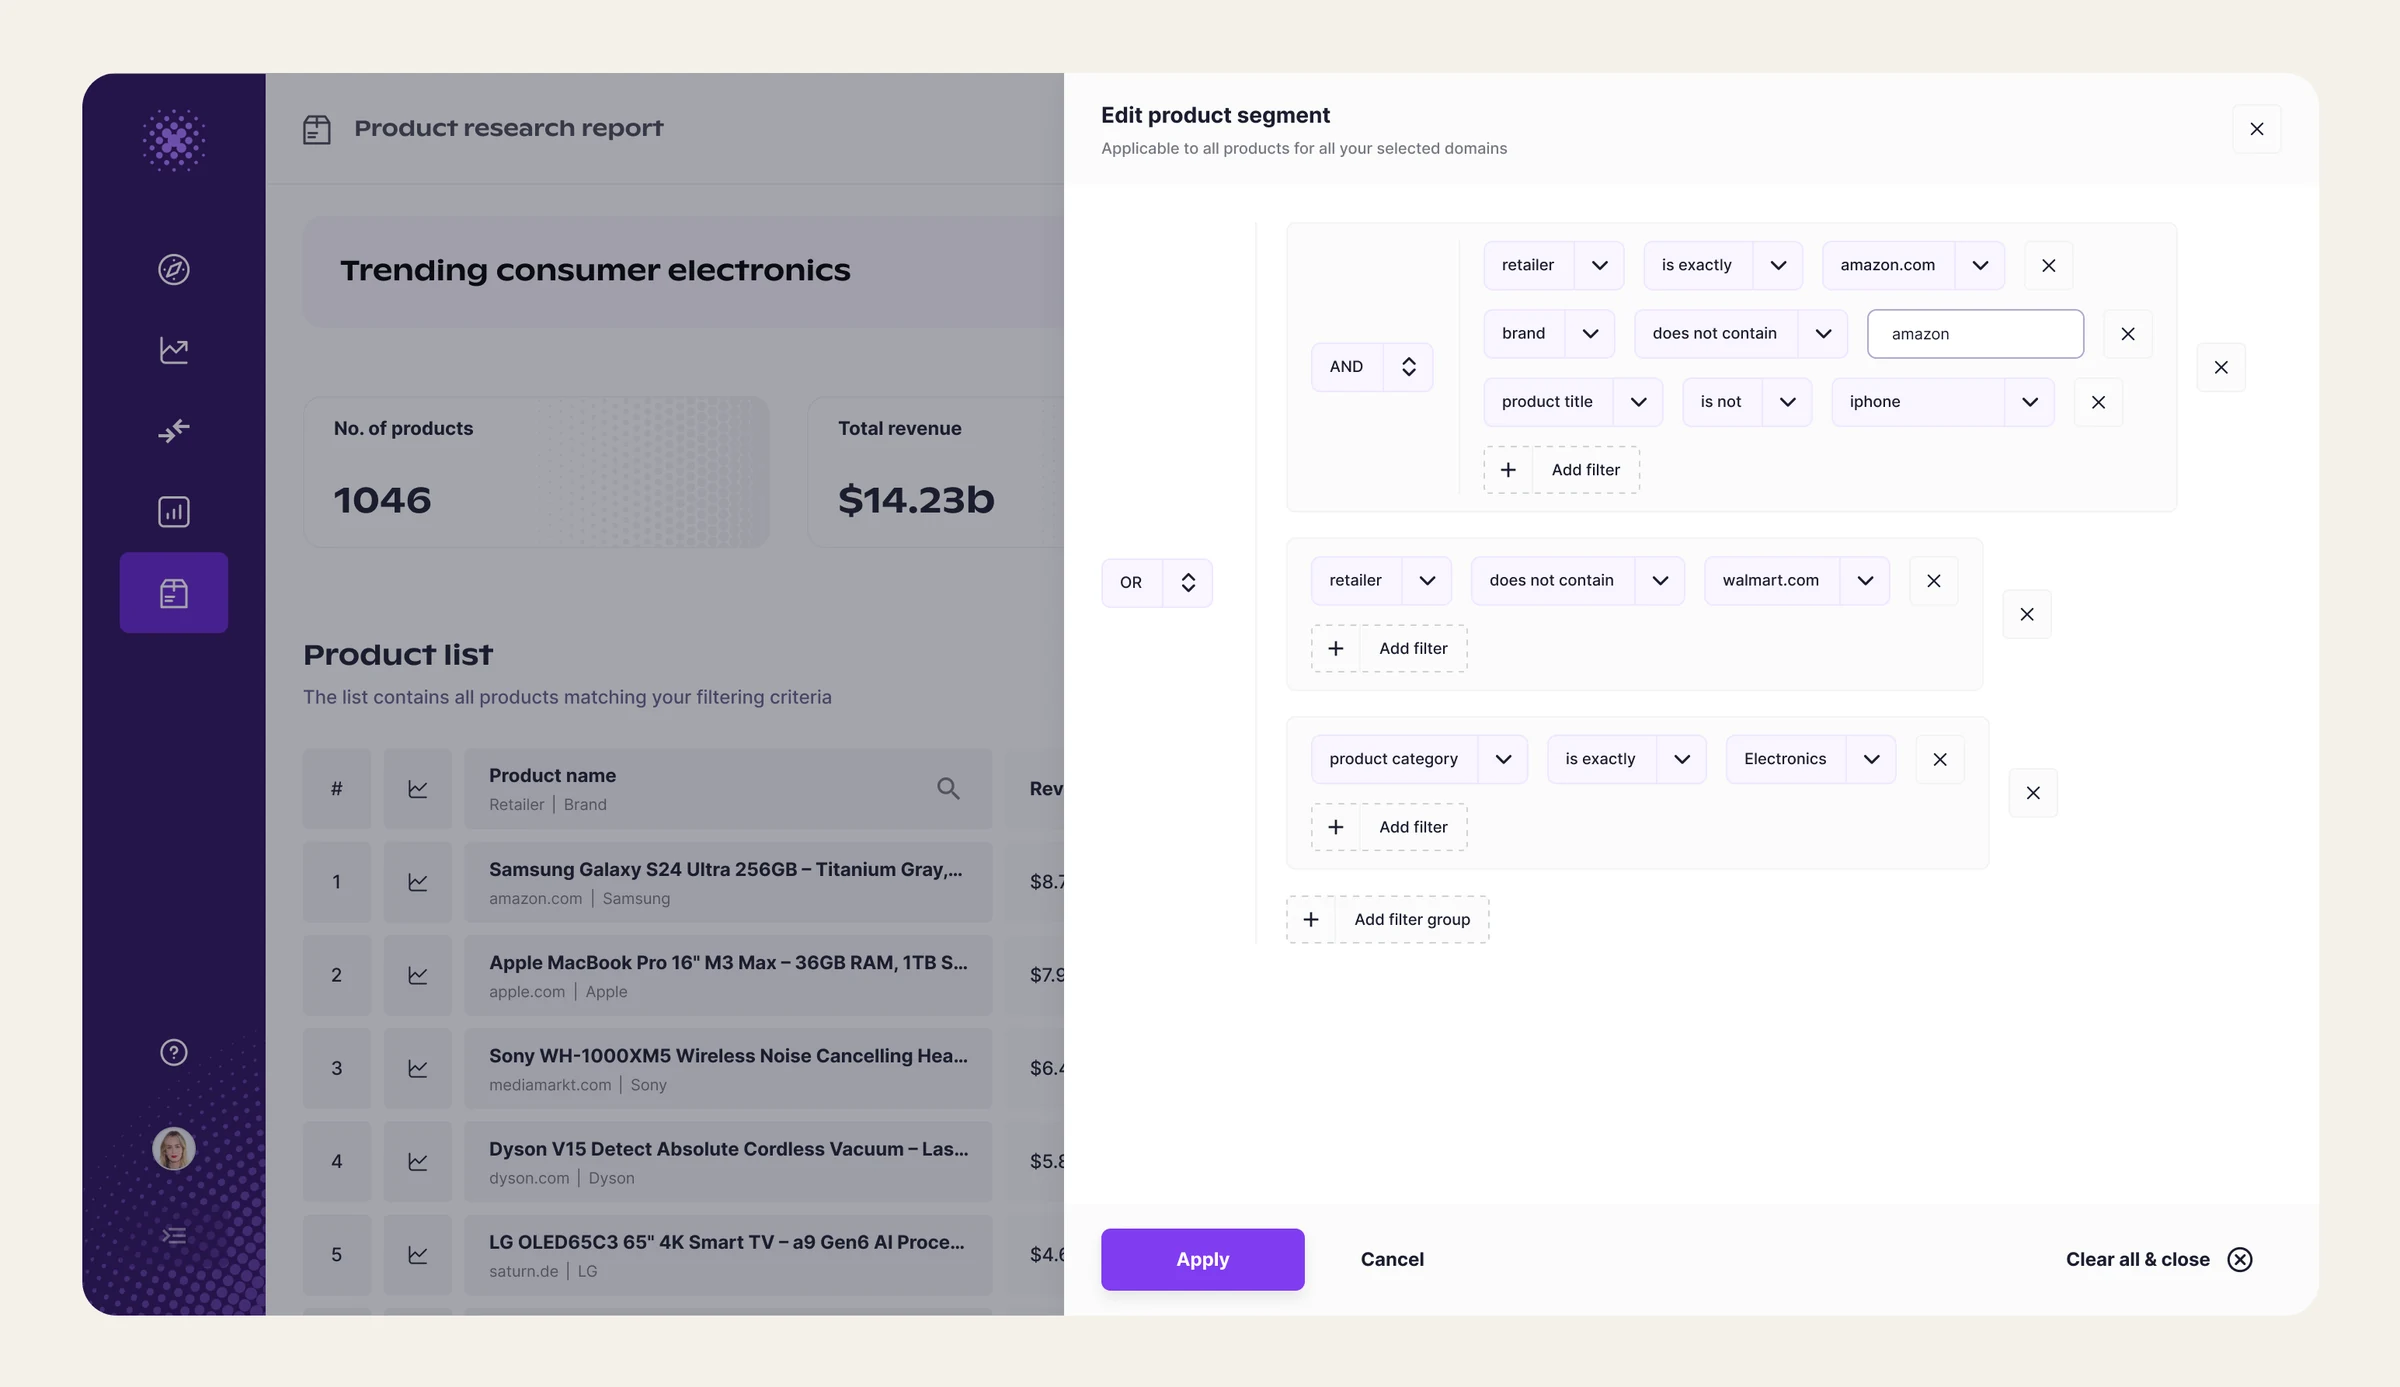
A feature where users could select competitors, then shape the underlying SKU dataset using both dimension (category, brand, model, color, size) and metric filters (revenue, units sold, conversion rate), landing on a set of SKUs that answered their specific question. Whether that was 'what shoe styles are trending across my top 5 competitors' or 'which products under $5 are driving the most revenue,' users could get there by combining the criteria that mattered to them.
Approach
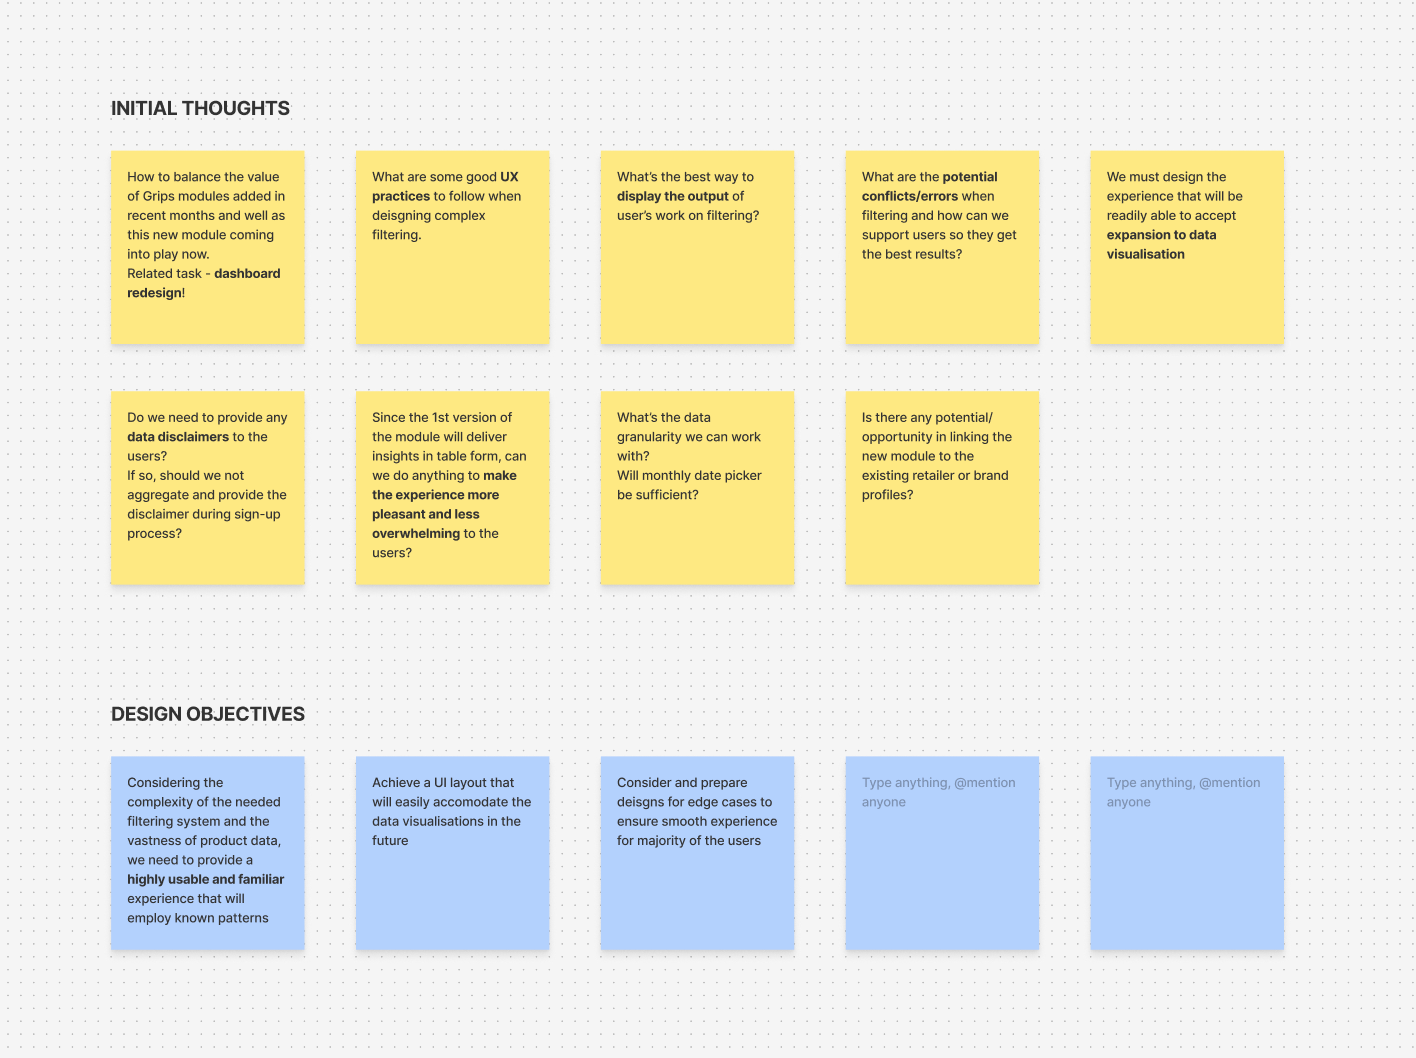
Initial thoughts on minimizing perceived complexity
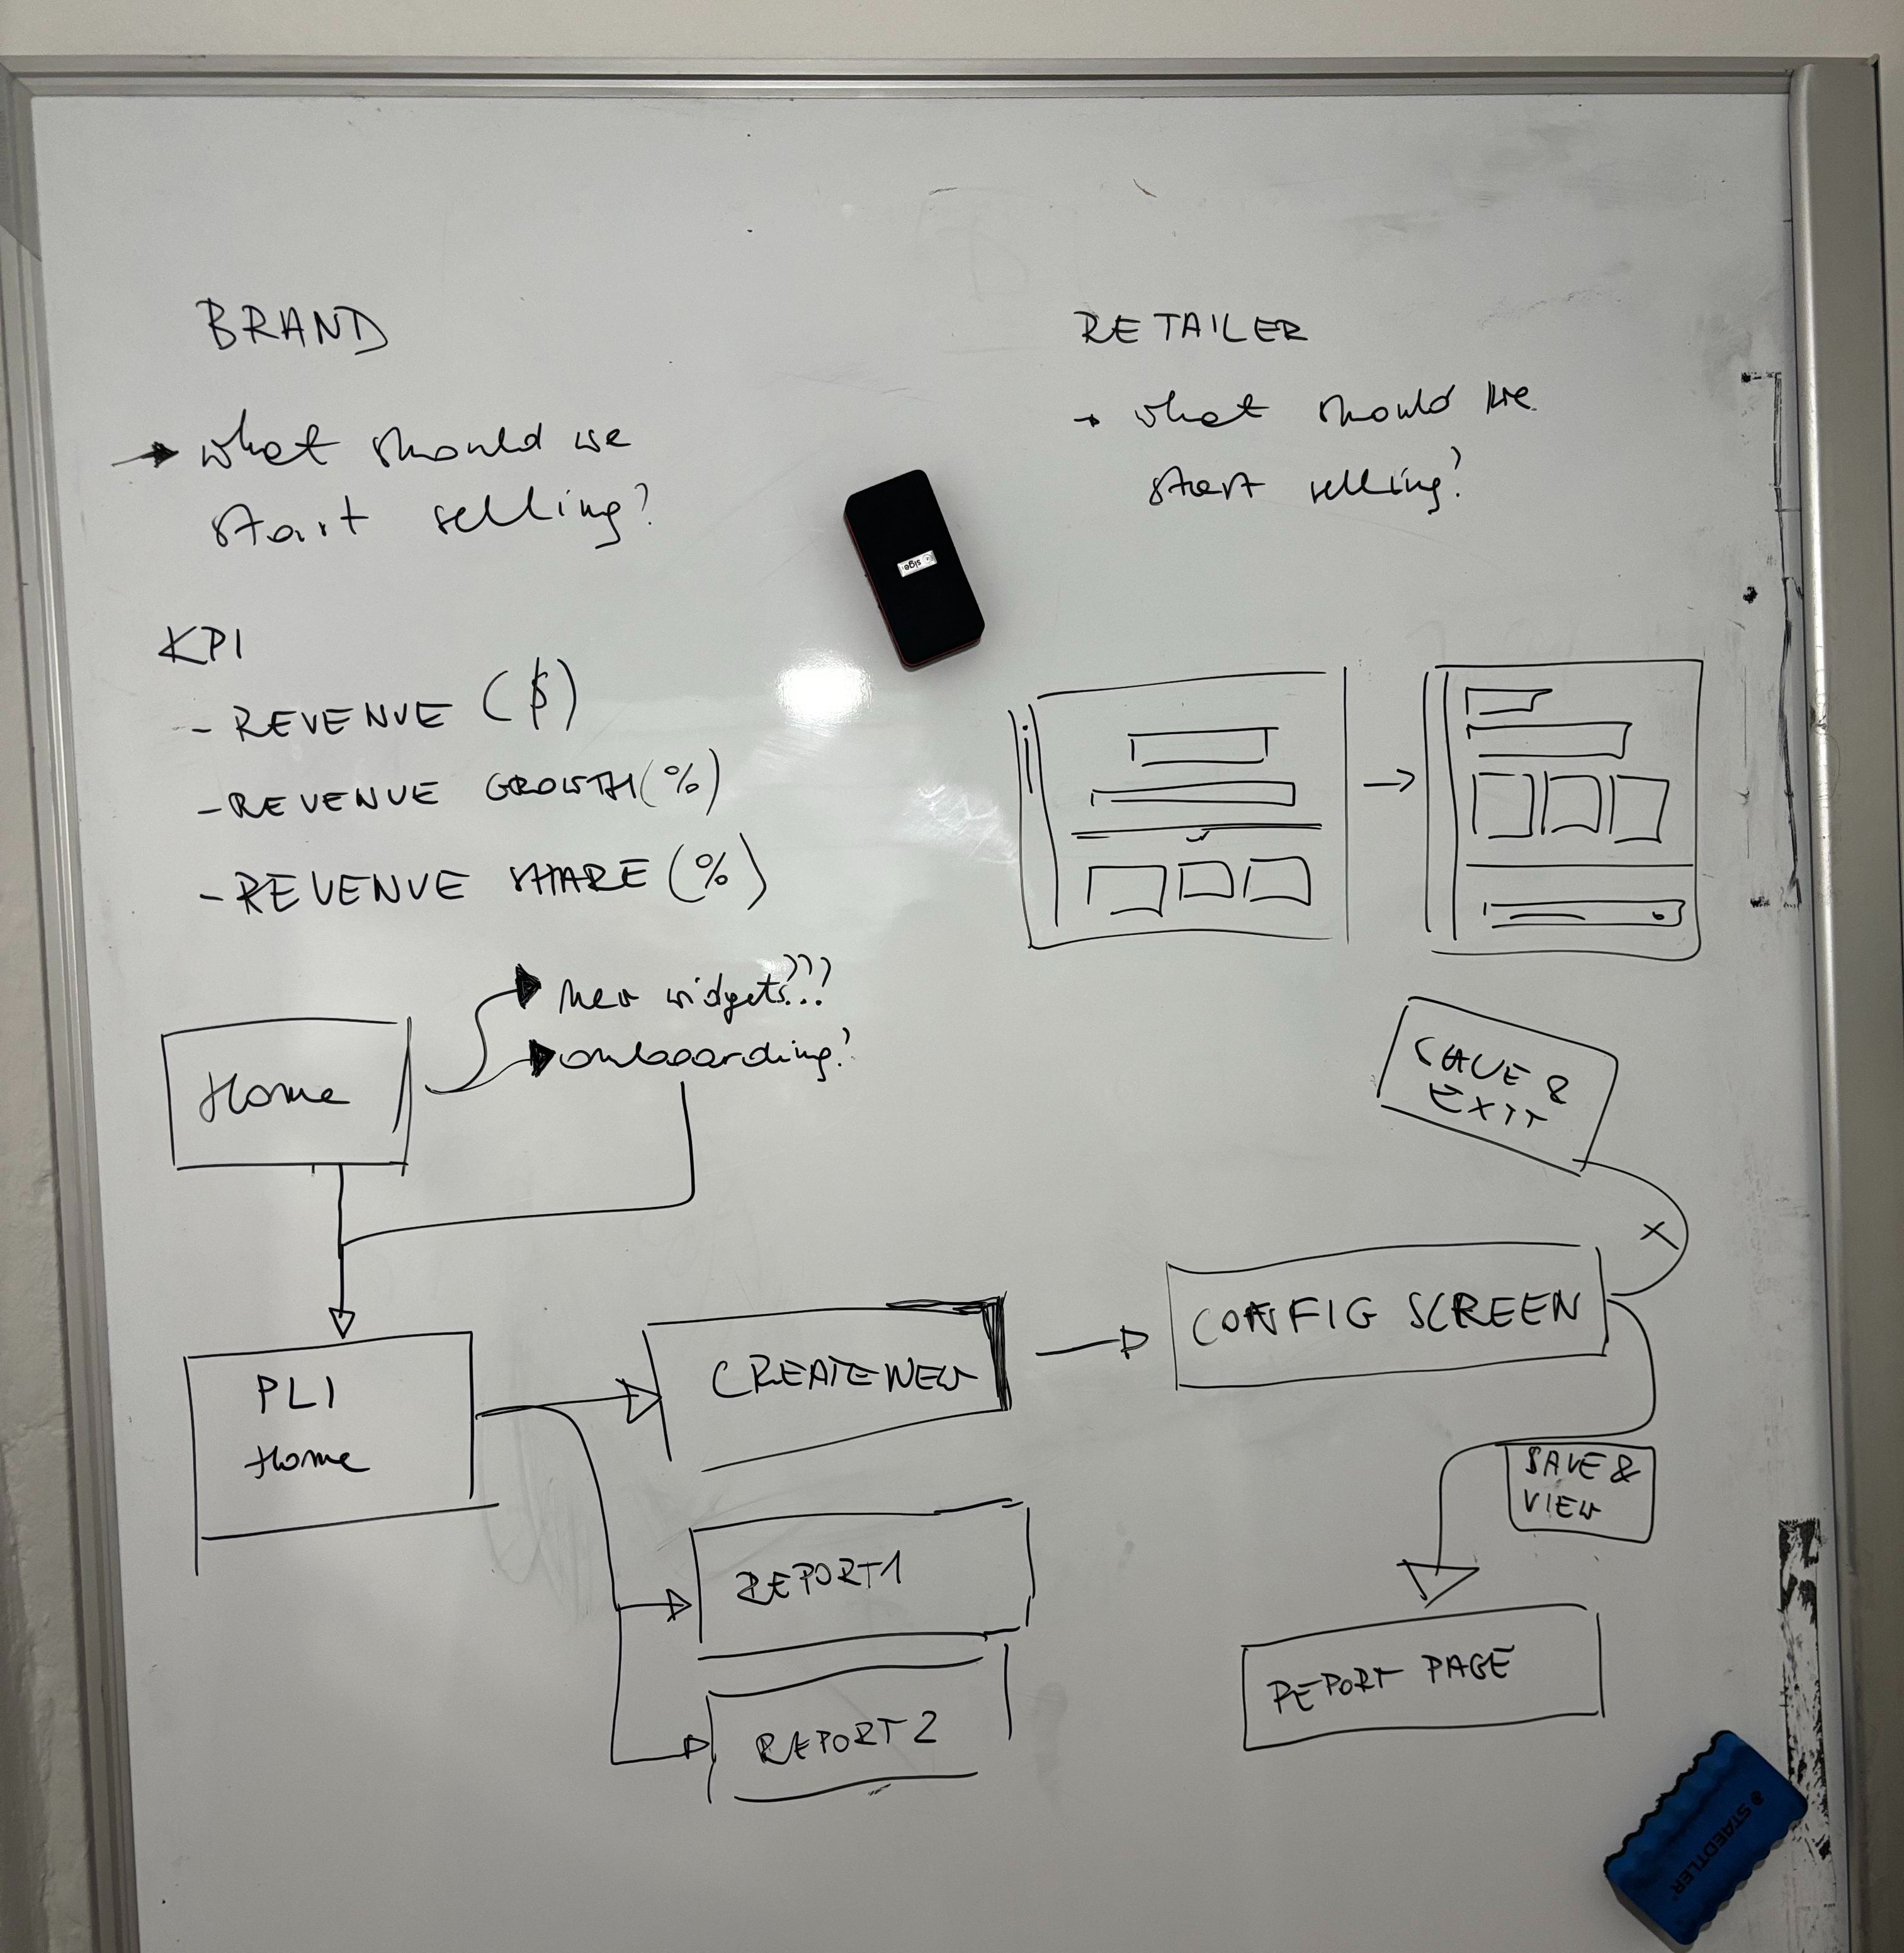
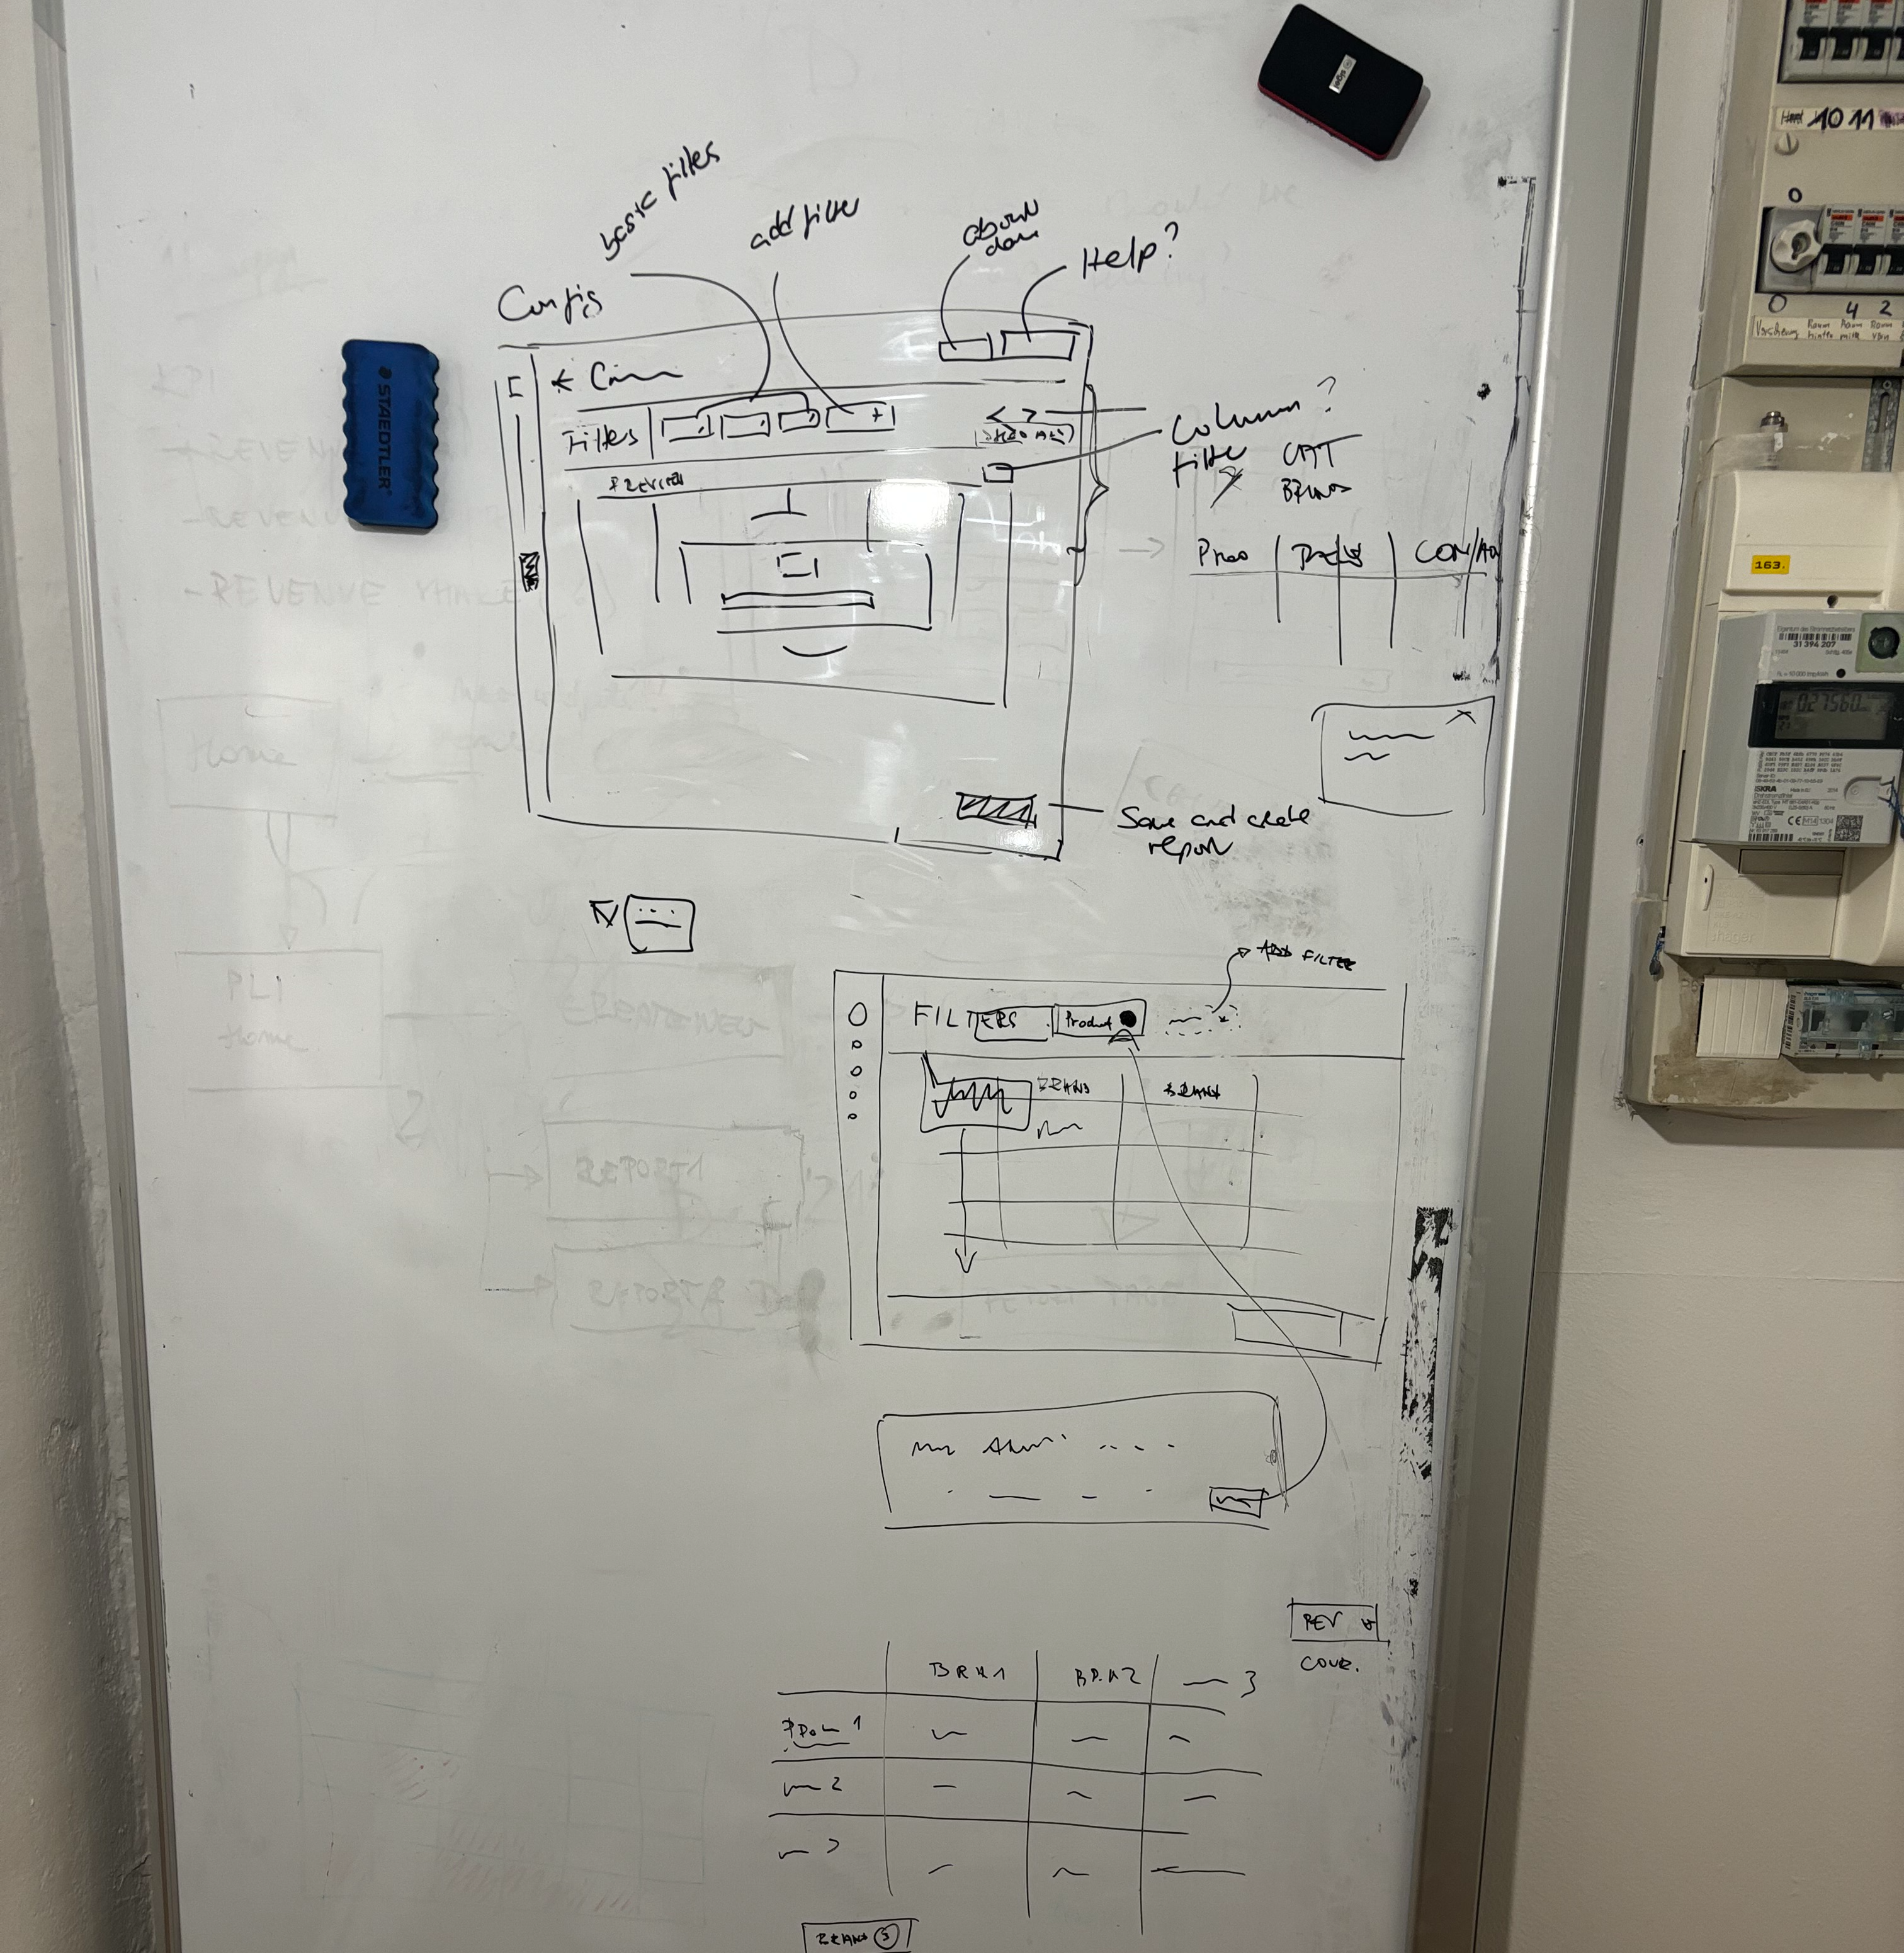
In initial discussions, the team agreed the core of the V1 feature would be a table of products matching the user's criteria, with visualizations planned for later iterations. Much of my early thinking focused on minimizing the perceived complexity of both the filtering and the table itself.
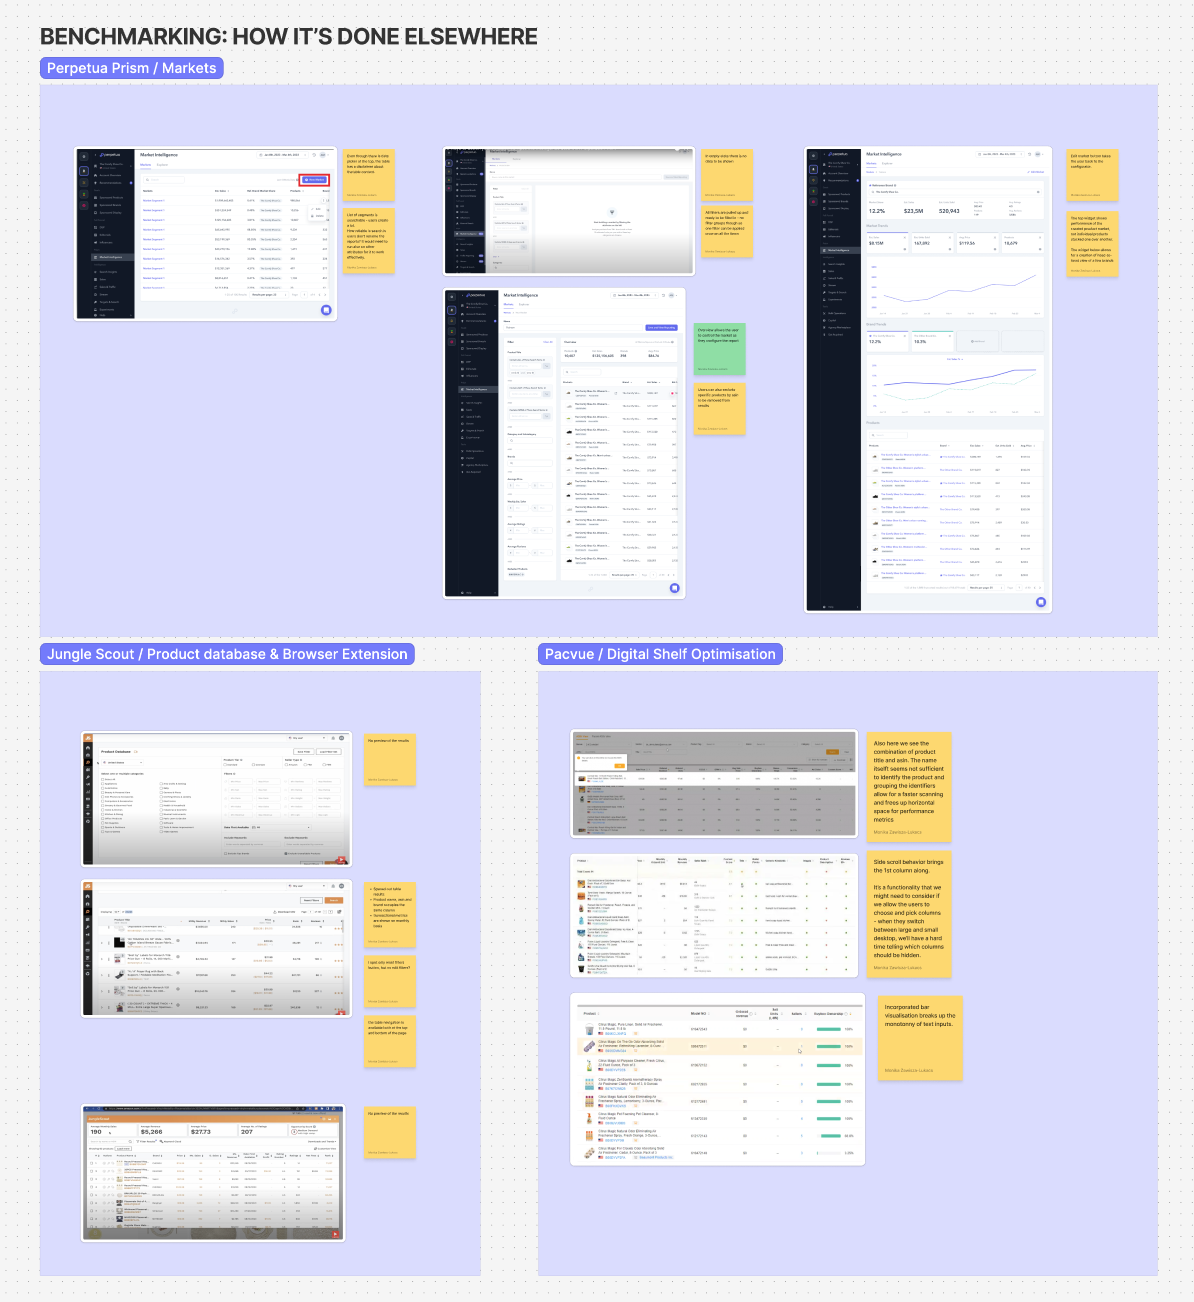
Learning from existing patterns
Since filtering would carry the most weight in building a report, I put significant research into advanced filtering patterns from direct competitors, so the solution would still feel familiar to users coming from those tools.
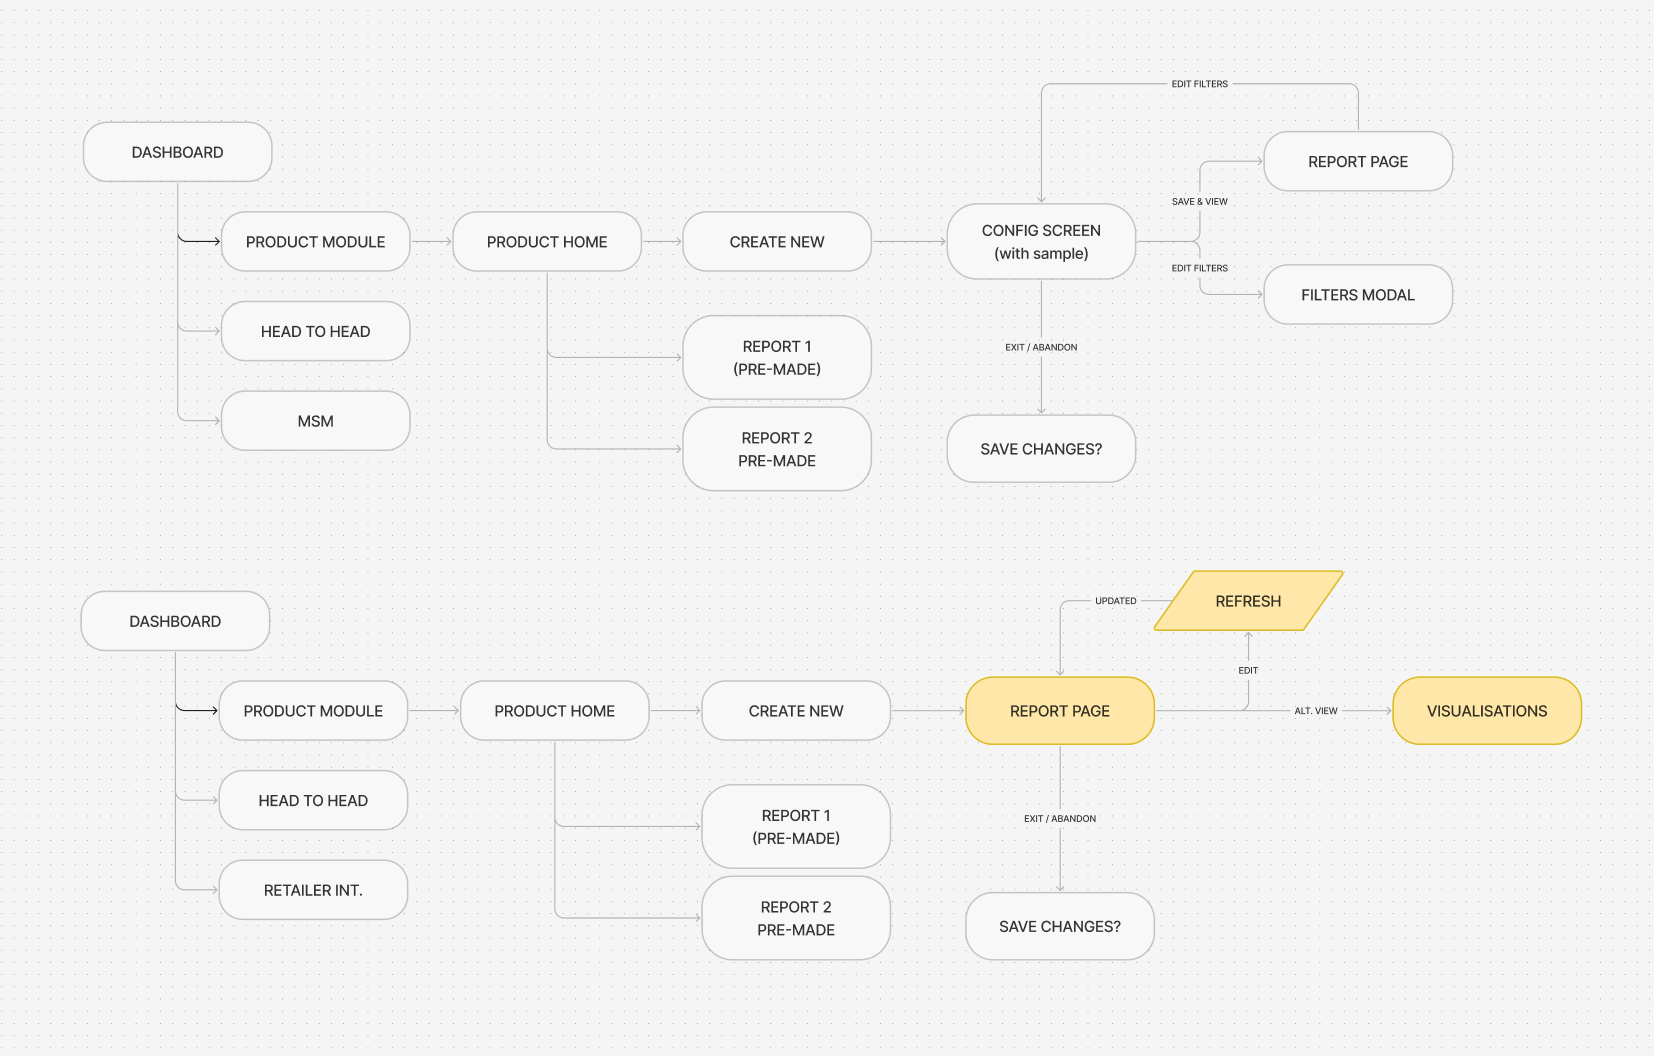
Fitting the module into the existing platform
I mapped out the flow to establish how the new module would fit within the platform, alongside Grips' existing features.
Revisiting technical reality over and over
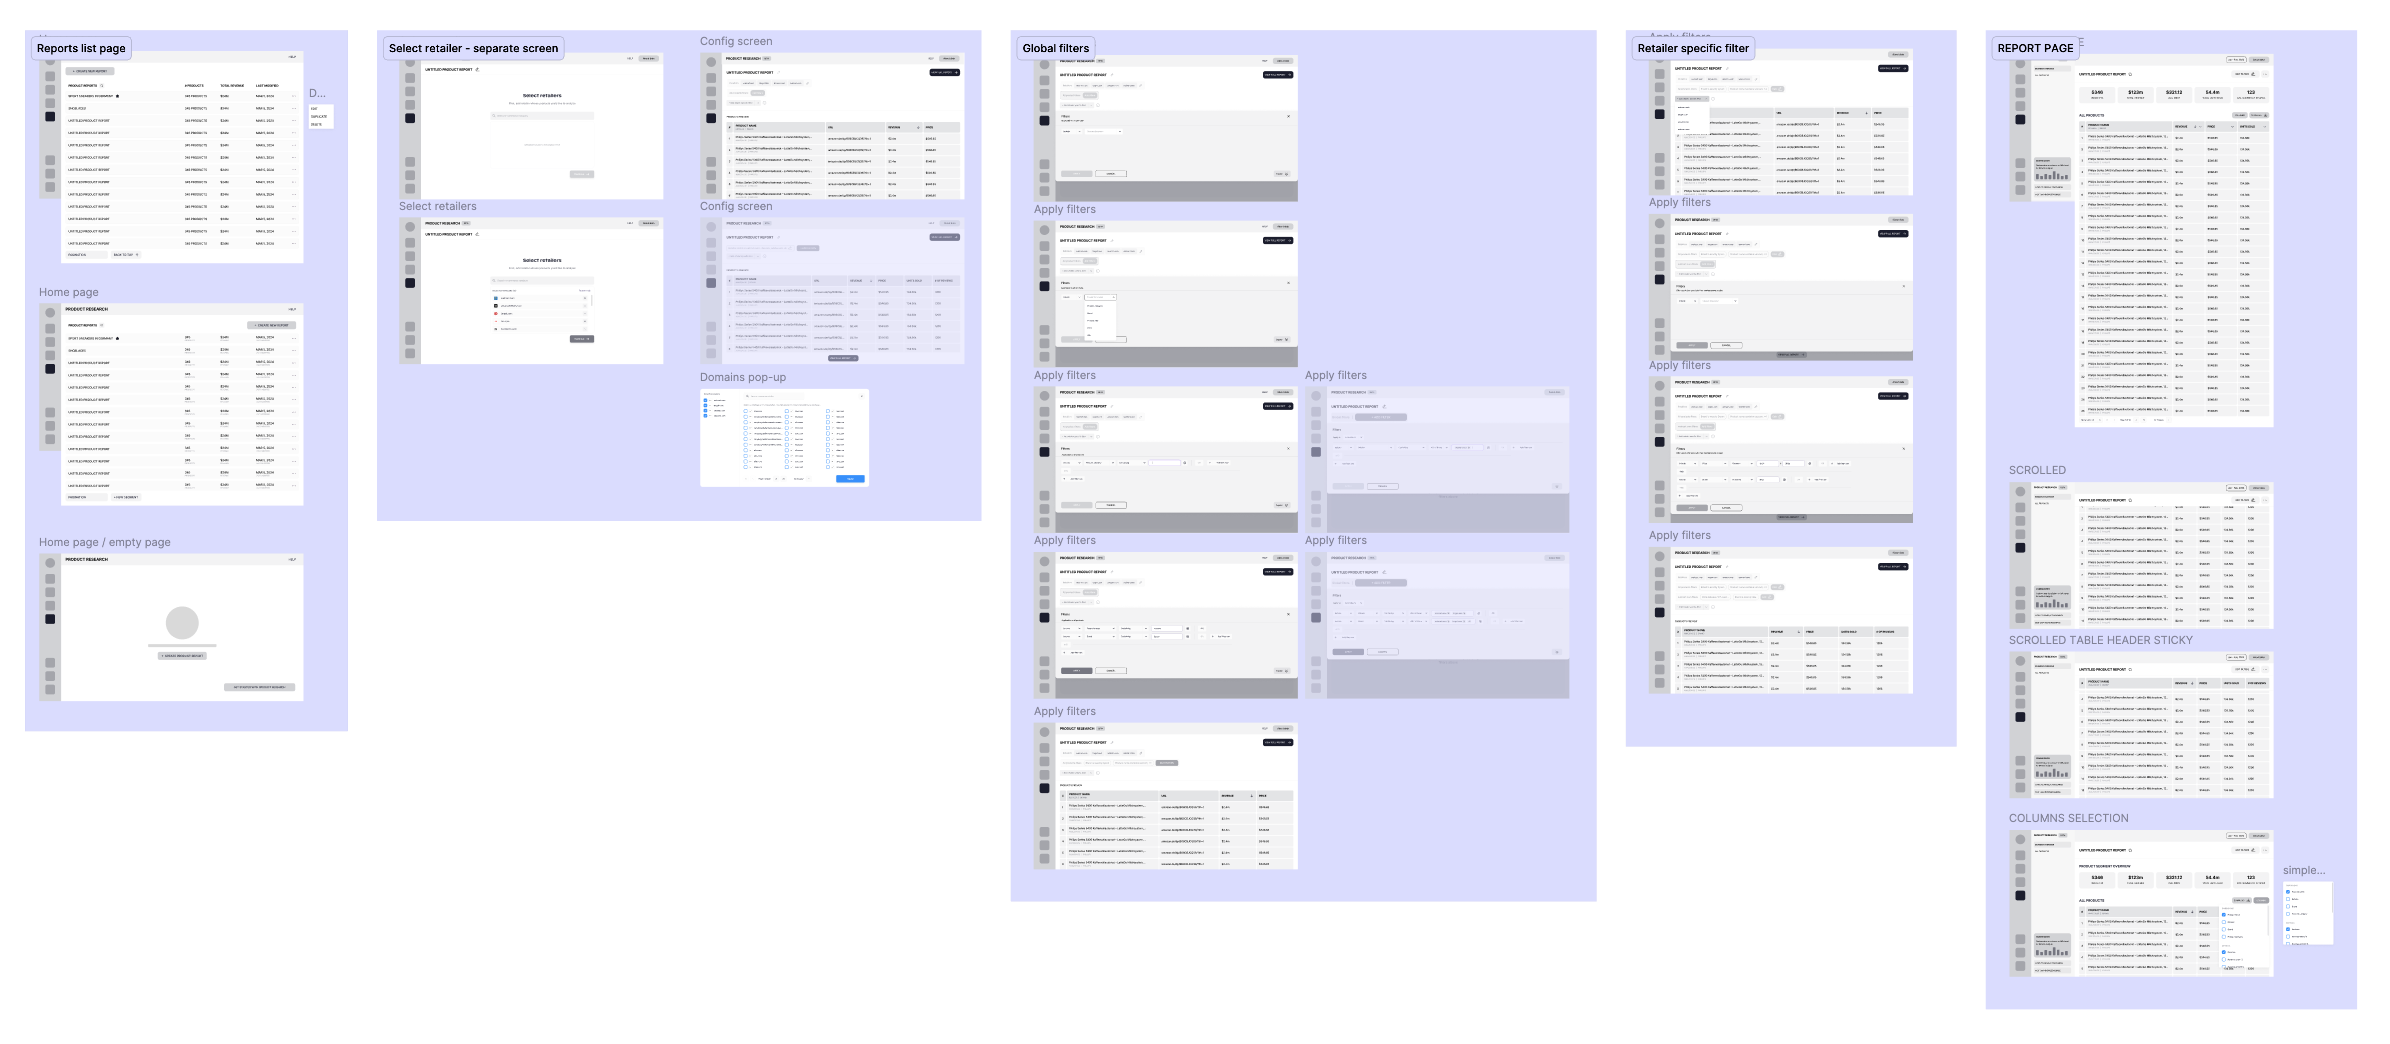
I made sure we spent real time discussing the mid-fi solution with developers, confirming the flow we envisioned for users was technically viable and would return the results they expected.
Design decisions
Where will the users experience the new dataset
Option 1
Integration with existing offering
- New data gains instant visibility from an existing, high-traffic flow
- Organic macro-to-micro flow: users investigate from retailer-level performance to SKU detail
Option 2
ShippedBuild a new module
- No risk of breaking flows onboarded users already rely on; safer to iterate on fast
- Reuses existing subscription model based access per module
To mitigate the risk of low discoverability, we added pointers and links in the existing module flows where users could benefit from deeper-analysis in the new module.
How to manage initial data load
Option 1
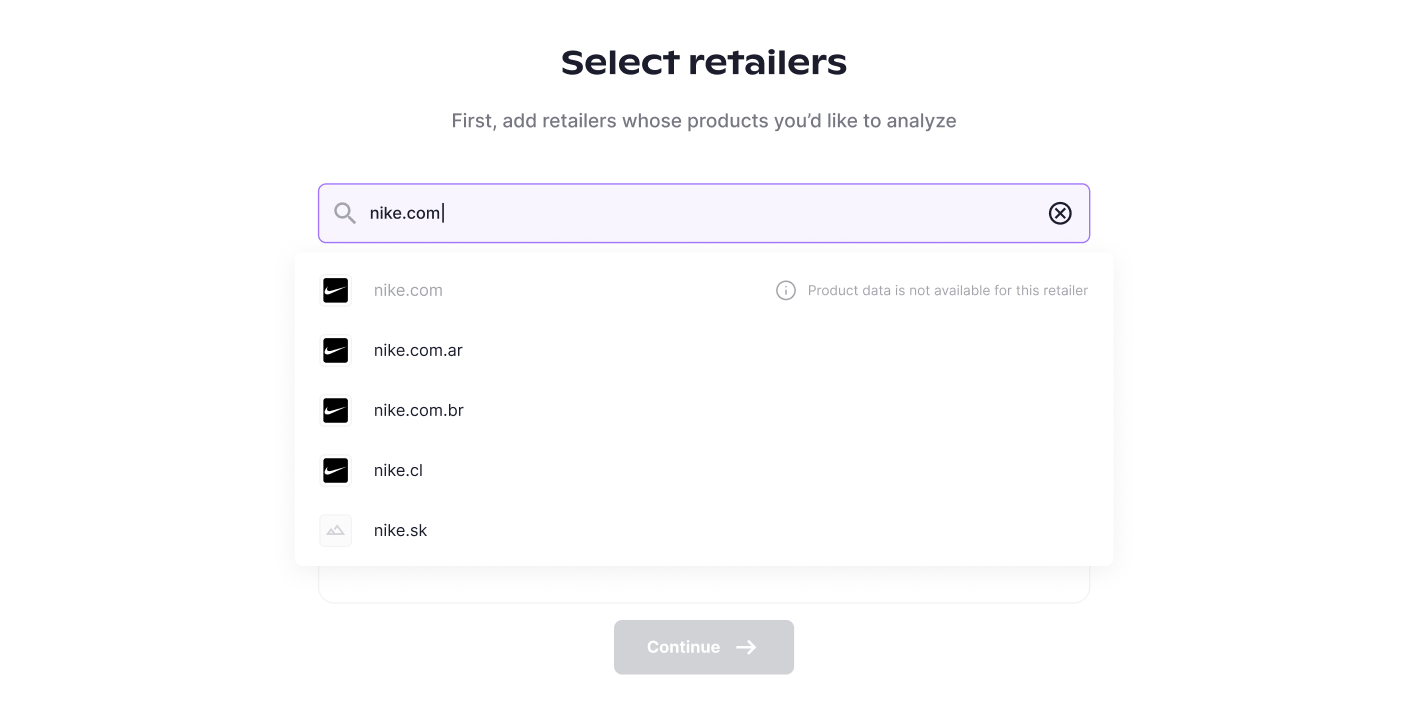
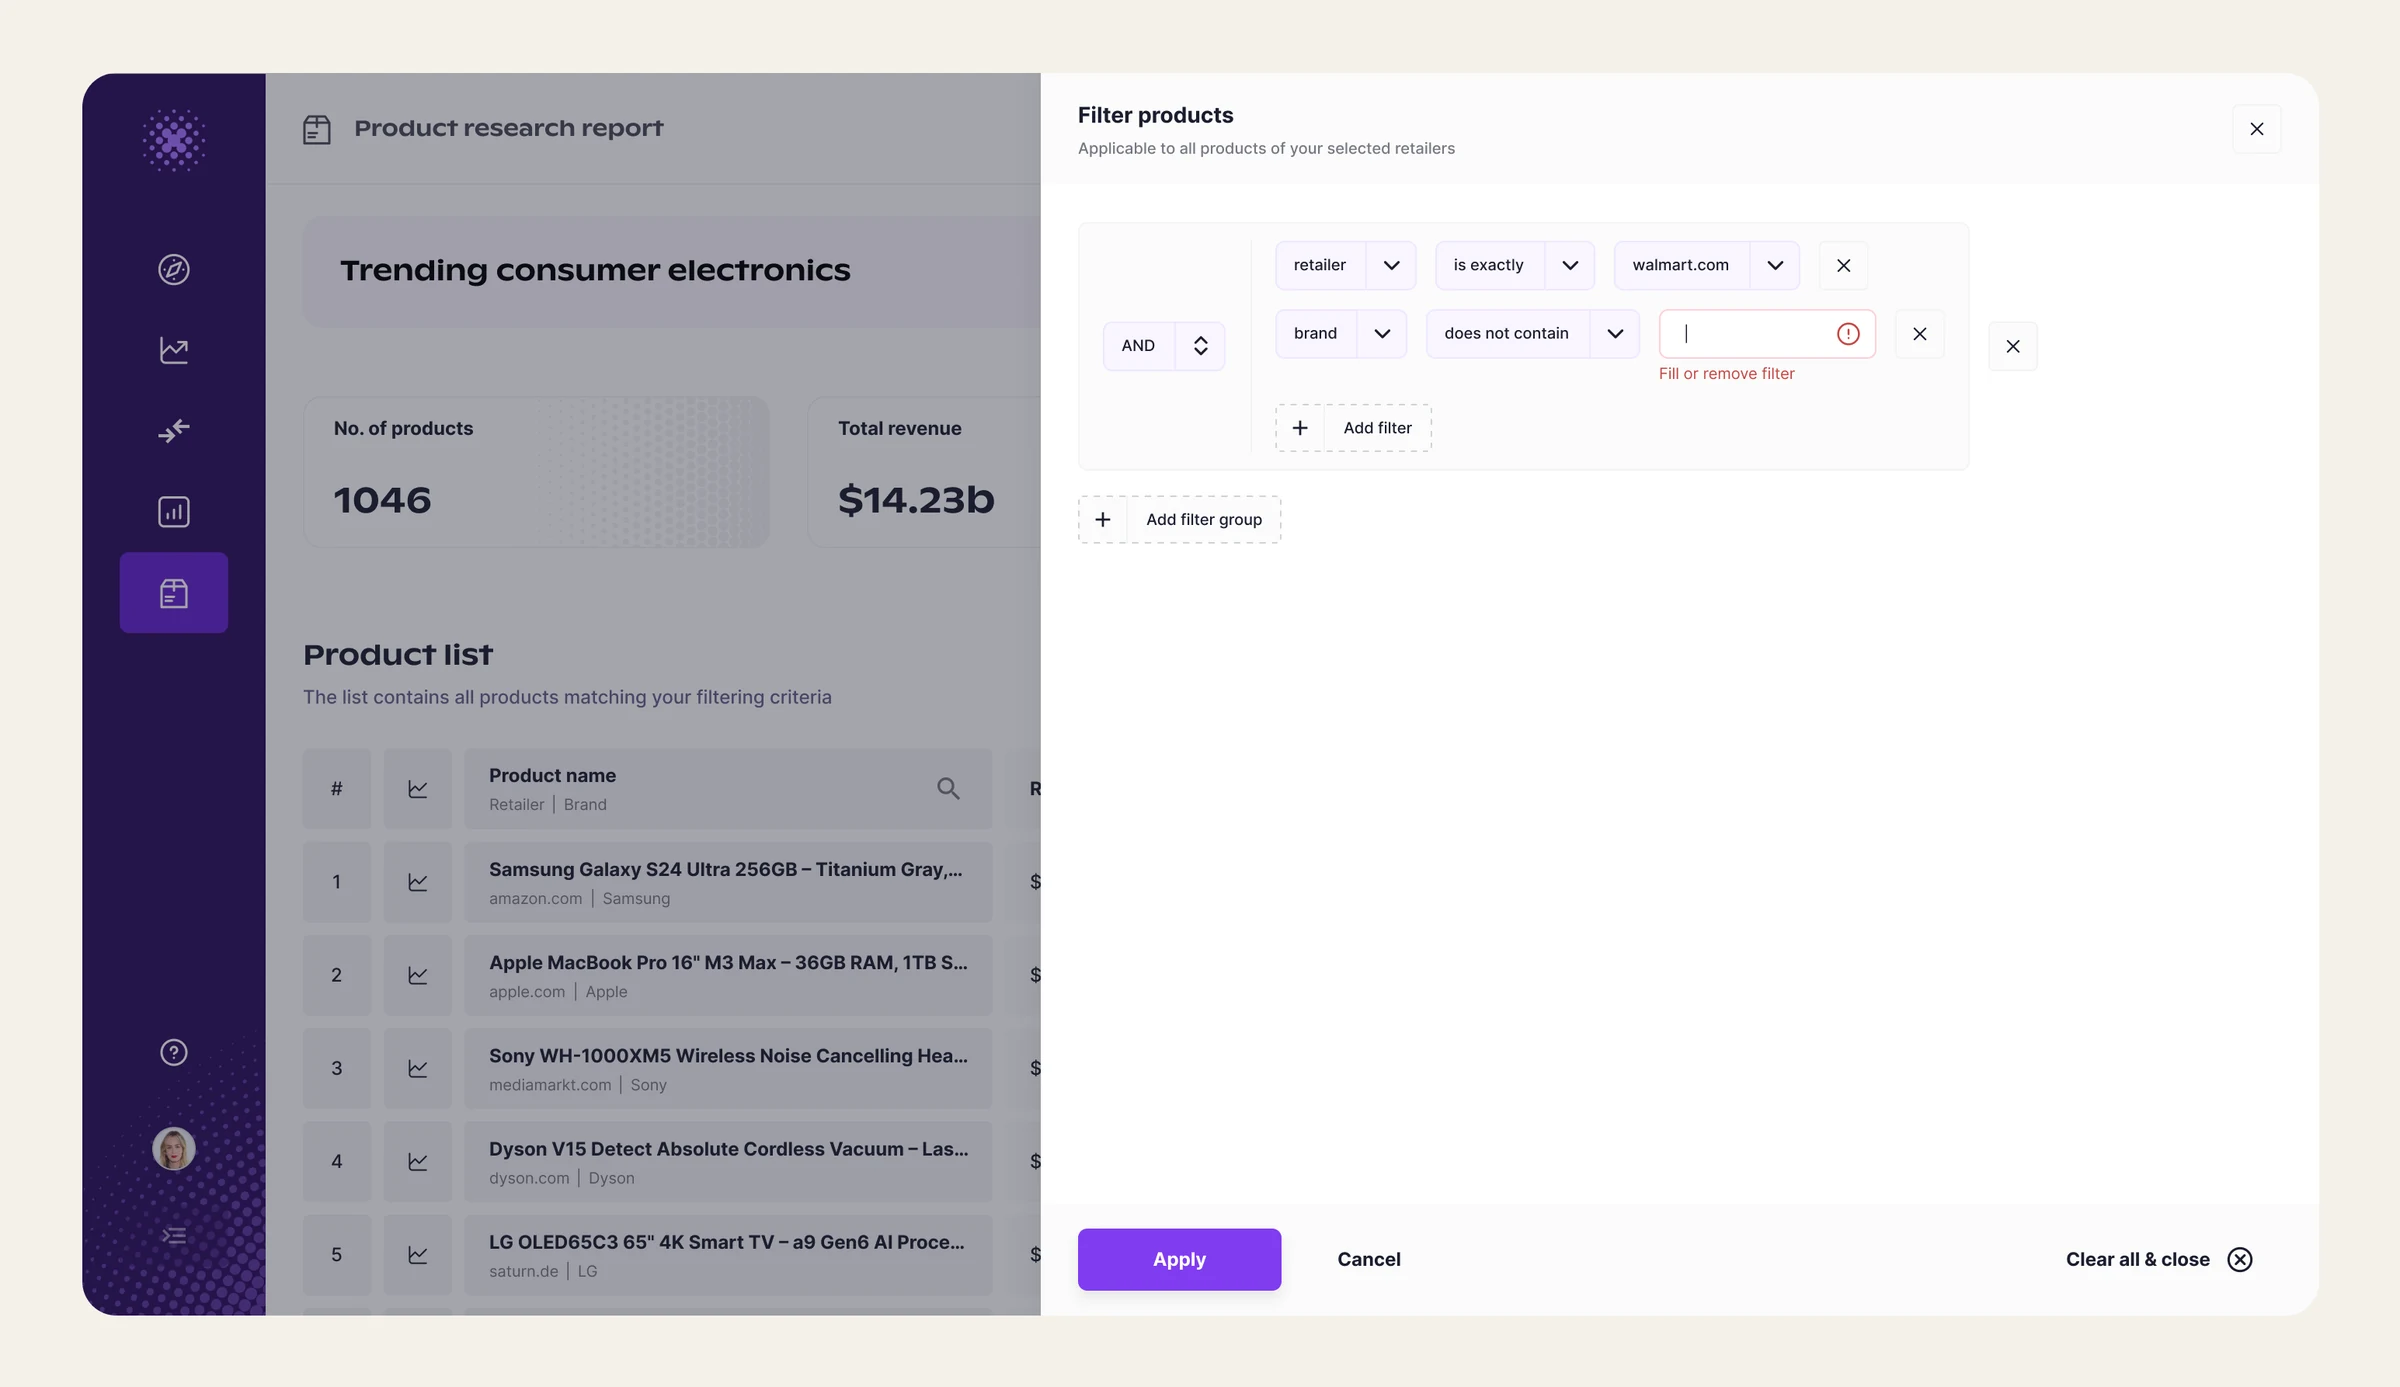
ShippedPre-narrow by retailer
- Reduces dataset before compute-heavy operations
- Anchors the report to competitor data - output is relevant from the first step
- Scalable solution even as the dataset grows and more retailers' data is added
Option 2
Browse the whole database
- No extra step for the user before user shapes the report in detail
- First time users are exposed to SKU specific filters upfront
While the extra step is a real cost, it is also a meaningful input to the report. The step does double duty: it protects performance and gets users to relevant answers faster.
How the filtering will live in the report
Option 1
In-page filtering
- Iterative approach - users can decide on next criteria based on the output
- Filter conflict are easy to spot as filters are applied in a linear fashion
Option 2
ShippedFilters in a side sheet
- Perceived performance lag mitigated with batch apply - users are able to set up multiple filters without wait time inbetween
- Supports advanced filtering more flexibly
This one was a close-call. Intuitively the in-page filters that come with more directness and conflict visibility, but it would've been a short-lived win. The data constraints needed a more sophisticated and flexible solution, that doesn't stall the users.
Outcome
How it shipped
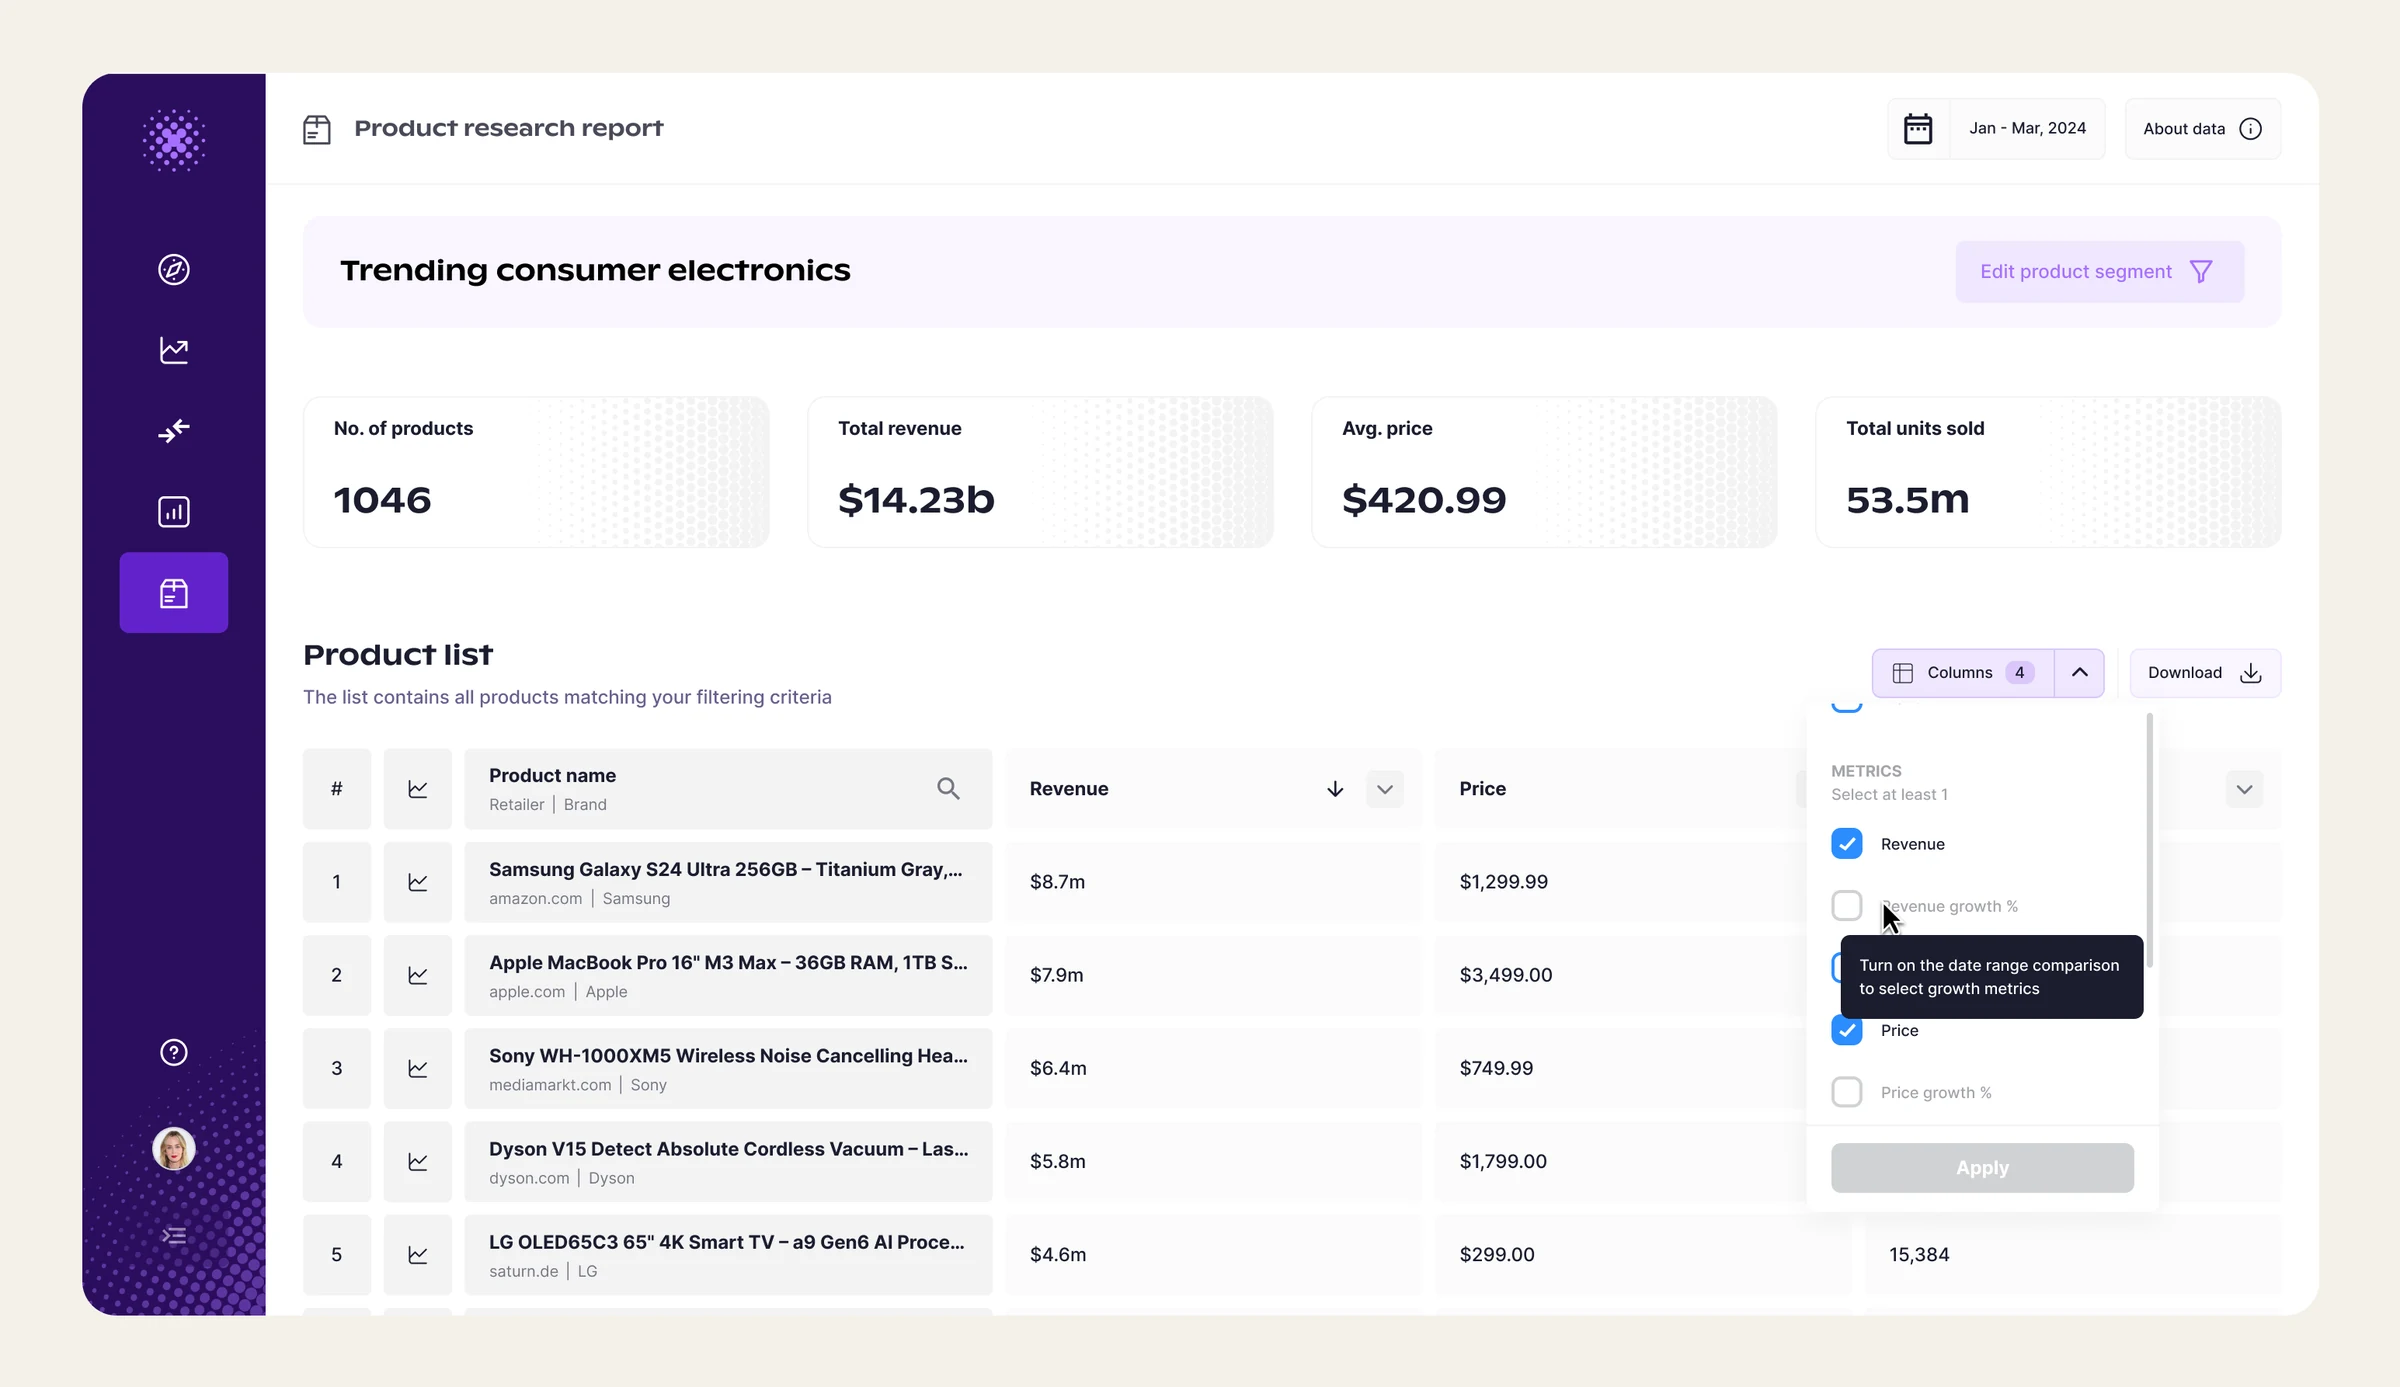
Once launched, the Product Research module consistently came up in customer feedback as one of the most valuable additions to Grips platform. Even without sophisticated data visualizations (out of scope for V1) the flexibility of the solution let users pull fresh insight to inform their strategy at any moment.
What didn't work
Despite the flexible interface, data variability and non-standard mapping made building a report a somewhat laborious process. Larger customers, with dedicated resources, built their own reports, but smaller customers, where one person often wore many hats, couldn't afford the time to learn the data specificities. They relied on Grips account managers to build reports on their behalf, which consumed time and resources.
Next iterations
- To improve the filtering experience, the plan for future iterations was to simplify it toward patterns more familiar from B2C shopping platforms
- Immediate efforts focused on giving users more context on individual product performance; the Product Research module was soon enriched with historical revenue and sales data.